The Net Position Report allows you to view beginning and ending net position calculations by Dept ID, Fund, Project, and Parent/Award ID. The term Net Position was previously known as “Equity”, “Fund Balance”, “Unexpended Balance”, and “Net Assets”. This step-by-step guide explains how to filter and run the report.
What Can I Learn from the Net Position Report?
Net Position is reported at the Fund/DeptID/Project/Activity Period/Function/Flexfield level, and is updated daily in MyReports.
Report Date Filters
The default date range starts July of the current fiscal year and ends with the current open month of the same fiscal year.

Chartstring Filters
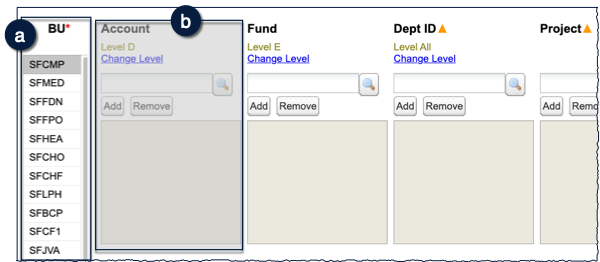
- Select Business Unit (BU), or multiple BUs – this is a required (*) field .
- In addition, at least one of the conditionally required fields denoted by an orange triangle (▲) must be selected.
- The Account field is not available in the chartstring filters to ensure the correct calculation of Net Position .

Report Specific Filters

Using the Report Specific Filters allows for further refining of results:
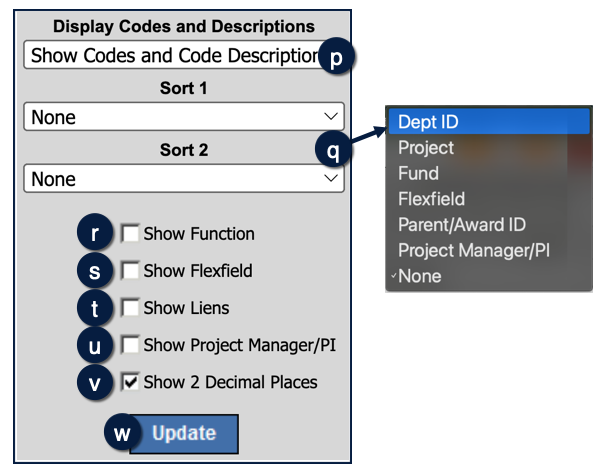
- Check to display Function .
- Check to display Flexfields .
- Check to display Liens .
- Check to display Project Manager/PI .
- Uncheck Show 2 Decimal Places to display the amount rounded to dollars .
- Display Sponsored, Non-Sponsored, or All (default) Funds .
- Limit results to Restricted, Unrestricted, or All (default) Funds .
- Choose Positive Net Position, Deficits Only, or All (default) .
- Display Codes and Descriptions – Display Codes Only (default), both Codes and Descriptions, or Descriptions Only .
- Report Sort 1 and Report Sort 2 allow you to apply one or two sort options to the report output .
Additional chartfield parameters may be selected as desired. See the Filtering and Running Reports in MyReports job aid for additional information and tips & tricks for using the filters to configure your report criteria.
Report Output Selection

- In addition to the report output selections of On Screen HTML (default), PDF, and Excel , you can choose Unformatted Data .
- The Unformatted Data output returns an Excel file that has no special formatting and a single row for column headings, making it the best source for pivot tables and other advanced spreadsheet analysis.
- Select your desired report output and click the Run Report button .
Working in the Report View
- Change the Codes and Descriptions display using the drop-down menu in the upper right-hand corner of the report .
- You may further refine your report using the Sort 1 and Sort 2 options to group and sort records with a subtotal for each grouping .
- Select Show Function checkbox to display Function .
- Select Show Flexfield checkbox to display Flexfields .
- Select Show Liens checkbox to display Liens for outstanding lien amounts and Projected Total with Liens .
- Select Show Project Manager/PI checkbox to Project Manager/PI .
- Deselect Show 2 Decimal Places to display amount rounded to dollars .
- Click Update to refresh after making your selections .

Tips and Tricks
- Net Position End of Period is calculated as:
Net Position Beginning Balance + Revenues – Expenses + Other Changes - Projected Total with Liens is calculated as:
Net Position End of Period – Liens - Click on the blue underlined amounts to drill through Revenues, Expenses, Other Changes, and Liens to display transaction details for further analysis.
- Net Position at the Function and Flexfield level is rolled up to the Fund/DeptID/Project/Activity Period level at year-end for all Business Units.
- Departments using Flexfields as a multi-year tracking tool for reporting can track all General Ledger Revenue, Expense, and Other Changes transactions across fiscal years. However, the Net Position balances at the Function and Flexfield levels will always revert to zero at the beginning of each fiscal year.
- The Report Date Range for this report can be changed by Month.
- Reports run for chartstrings that include Function or Flexfields will not show a Beginning Net Position balance at the start of each fiscal year. (Refer to the Understanding Net Position job aid for more details).
- You can sort in ascending or descending order on any column by clicking the up (▲) and down (▼) icons.
Additional Information and Assistance
- More information about MyReports, including how to request access and additional training, can be found in the MyReports section of the Controller’s Office website.
- If you require help with a technical problem or have a question about a specific report, contact the Controller’s Office Solution Center at [email protected] or 415.476.2126.
- To stay informed about MyReports news, follow the directions on the MyReports section of the Controller’s Office website to join the MyReports ListServ.
