The Current Year vs. Prior Year Actuals Comparison Report provides a side-by-side comparison of the current fiscal year’s actual transactions through the last closed month and the previous fiscal year’s actual transactions through the same month. Report defaults to Level C of the account tree, but can also be viewed at Account Level B through F. This step-by-step guide explains how to filter and run the report.
What Can I Learn from the Current Year vs. Prior Year Actuals Comparison Report?
- Displays a summary of Revenue and Expense Accounts that make it easy to compare current year actuals to prior year actuals
- Displays variances between the two fiscal years in both dollars and percentage
Report Date Filters
The date for the Current Year vs. Prior Year Actuals Comparison Report cannot be changed and always runs as of the latest month.

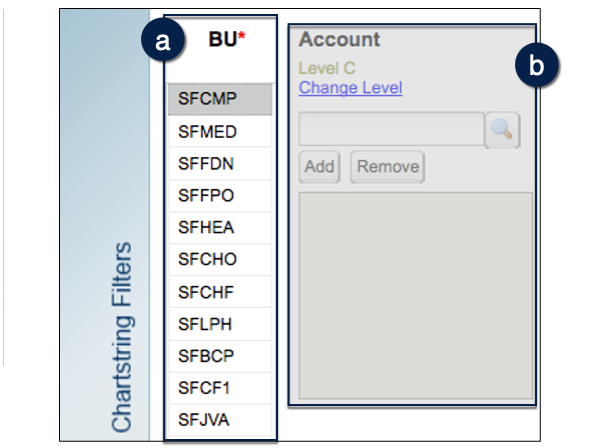
Chartstring Filters
- Business Unit (BU) is the only required (*) Chartstring Filter. The filter page defaults to select only the SFCMP, or Campus BU. You may override the default and select another individual BU or multiple BUs .
- The Current Year vs. Prior Year Actuals Comparison Report displays Revenue, Expense, and Other Changes; additional filtering by Account is not available .
Additional chartfield parameters may be selected as desired.
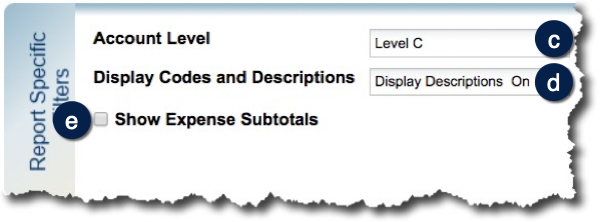
Report Specific Filters
- Select a specific Account Level from B - F (defaults to level C) .
- Choose whether to Display Codes Only, Display Codes and Descriptions, or Display Descriptions Only (default) .
- Click to Show Expense Subtotals .
Report Output Selection
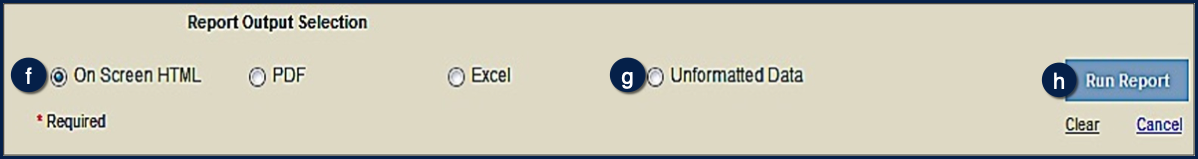
- In addition to the report output selections of On Screen HTML (default), PDF, and Excel , you can choose Unformatted Data .
- The Unformatted Data output returns an Excel file that has no special formatting and a single row for column headings, making it the best source for pivot tables and other advanced spreadsheet analysis.
- Select your desired report output and click the Run Report button .
In both Excel outputs (standard Excel and Unformatted Data), the workbook will contain at least two tabs. The first tab/sheet always displays the entered filter criteria. The second tab/sheet displays the data and differs depending on whether you selected standard Excel or Unformatted Data.
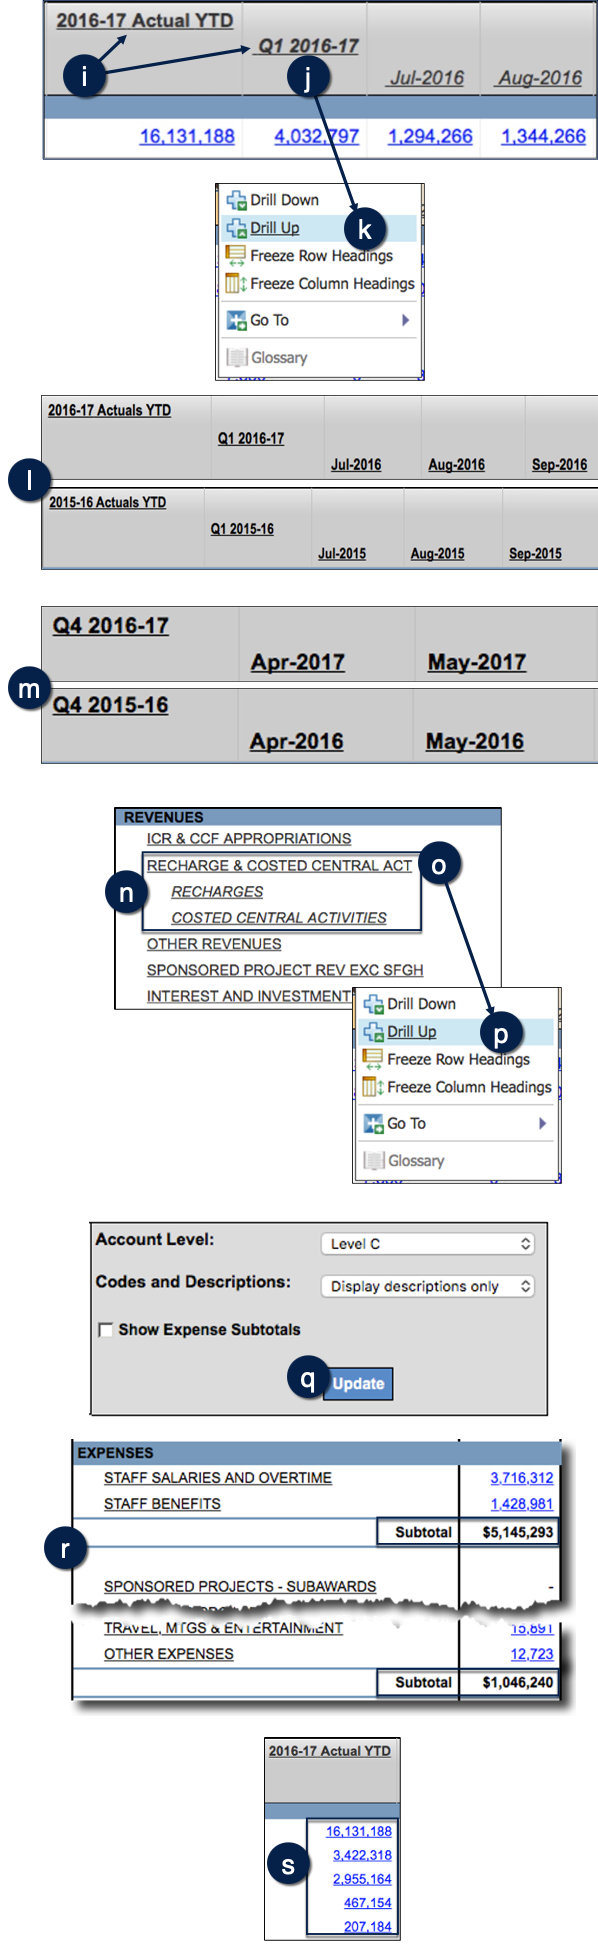
Working in the Report View
- You can expand Year-to-Date and Year-End columns to display quarters, and you further expand the quarters to show Months:
- Click the heading of the column you want to expand .
- To collapse a heading:
- Right-click the heading to collapse .
- Click Drill Up from the pop-up menu .
- Click the heading of the column you want to expand .
- The Current Year vs. Prior Year Actuals Comparison Report only displays closed months that can be compared to the prior year:
- If all months within the Year-To-Date (YTD) are closed, they will be compared with the prior year’s actuals .
- If a month within the YTD view is not closed, neither the YTD month nor the prior year month will display, since there is nothing to compare .
- If all months within the Year-To-Date (YTD) are closed, they will be compared with the prior year’s actuals .
- You can expand Account levels to show more detail at a lower level of the Account tree:
- Click the Account you want to expand, e.g., Recharge & Costed Central Act expands into Recharges and Costed Central Activities .
- To collapse an Account:
- Right-click the Account to collapse .
- Click Drill Up from the pop-up menu .
- Click the Account you want to expand, e.g., Recharge & Costed Central Act expands into Recharges and Costed Central Activities .
- You can also change Account levels, Codes and Descriptions, or Show Expense Subtotals within the report view in addition to the Filter Page. Make selections and click Update to refresh the report .
- When Show Expense Subtotals is checked, subtotal rows are added in the Expenses section only .
- When a value displays as a blue hyperlink, there is additional detail available:
- Click the amount you want to see more details about; a Transaction Detail Report (TDR) opens up in a new tab/window .
Tips and Tricks
- The MyFavorites functionality allows you to save and retrieve frequently used filter criteria. See the Managing and Scheduling MyFavorites in MyReports job aid for instructions on saving report parameters to MyFavorites, and how to select and run a saved Favorite.
- For the easiest navigation when using MyReports, close extra browser tabs/windows (usually the result of drilling through to another report) when you have completed reviewing and/or exporting the information.
Additional Information and Assistance
- More information about MyReports, including how to request access and additional training, can be found in the MyReports section of the Controller’s Office website.
- If you require help with a technical problem or have a question about a specific report, contact the Controller’s Office Solution Center at [email protected] or 415.476.2126.
- To stay informed about MyReports news, follow the directions on the MyReports section of the Controller’s Office website to join the MyReports ListServ.